TRANSFORM DATA INTO ACTIONABLE INSIGHTS

Microsoft Power BI Solutions UK

Microsoft Power BI is a leading business intelligence (BI) platform that helps organisations turn raw data into clear, interactive insights. From dashboards and reports to predictive analytics, Power BI enables faster, more informed decision-making across every department.

Whether you are a finance team tracking performance, a sales team analysing pipelines, or an operations team monitoring efficiency, Power BI brings your data together in one secure, visual platform.

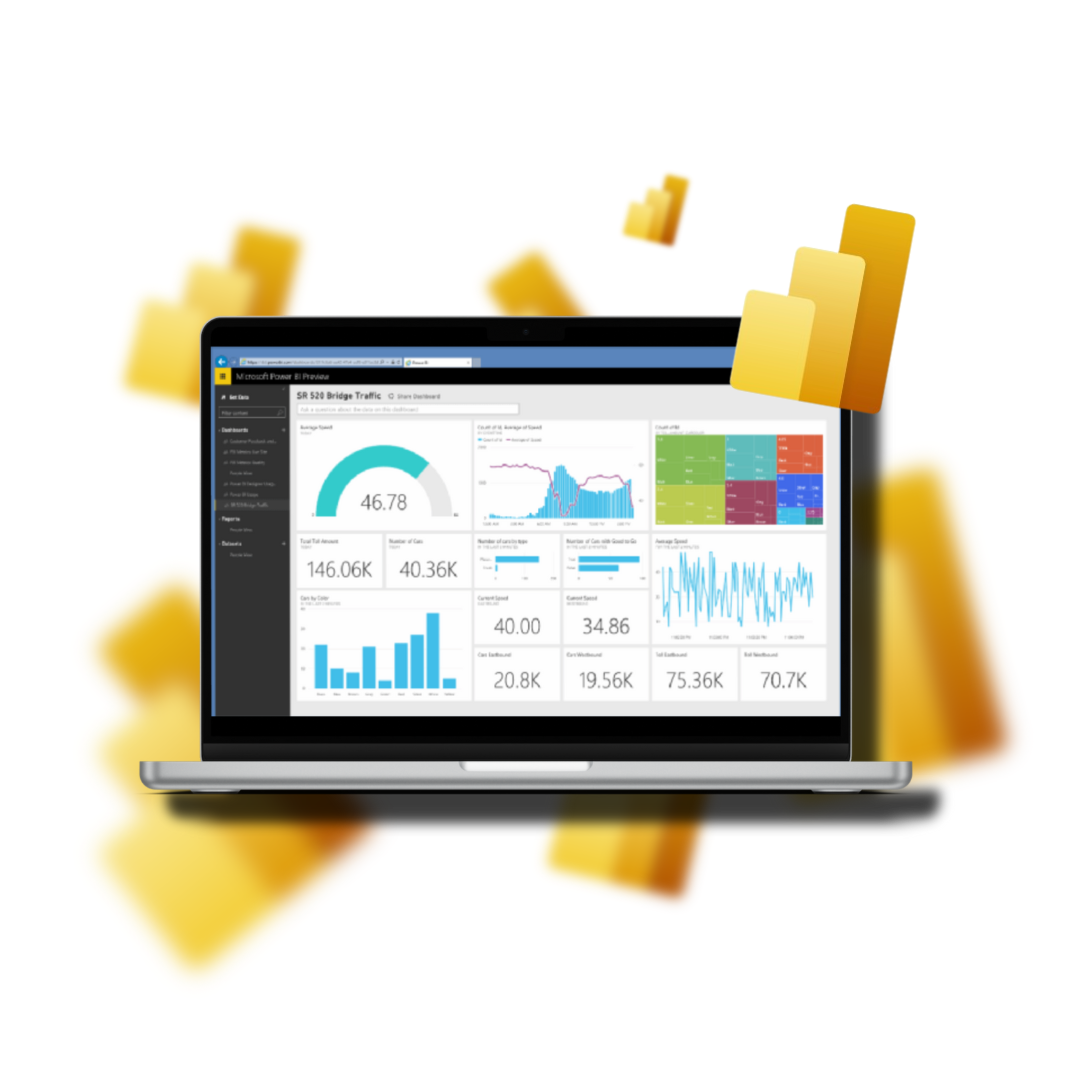
A Microsoft Power BI dashboard with interactive charts on a laptop screen, surrounded by yellow data shapes on a dark background.
140%

ROI over three years

8.32

Million USD net present value

45%

decrease in application development costs

BRING SCALABILITY AND FLEXIBILITY TO YOUR BUSINESS

Why Microsoft Power BI Matters for Modern Businesses

Businesses today generate more data than ever, but without the right tools, it remains underused. Power BI solves this by connecting multiple data sources and presenting them in real time through interactive dashboards.

Key benefits include:

  • Centralised reporting across your organisation
  • Real-time business performance tracking
  • Improved forecasting and trend analysis
  • Reduced reliance on manual Excel reporting
  • Faster decision-making with live dashboards

Power BI is designed to integrate seamlessly with Microsoft 365, Microsoft Azure, and Dynamics 365, making it a natural fit for organisations already within the Microsoft ecosystem.

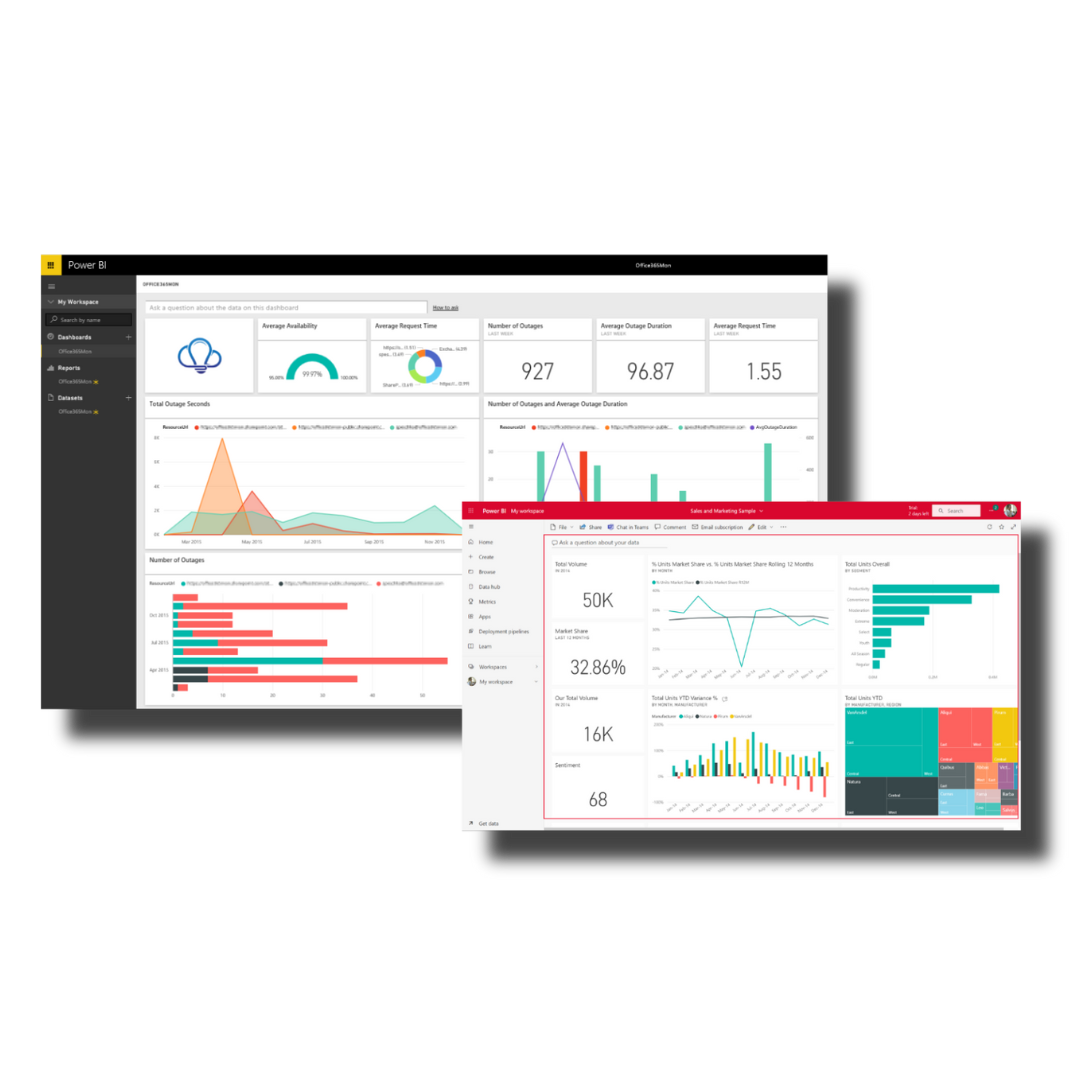
Dashboards in Microsoft Power BI show data visualisations with multicolored charts, executive metrics, and analytics panels across multiple screens.
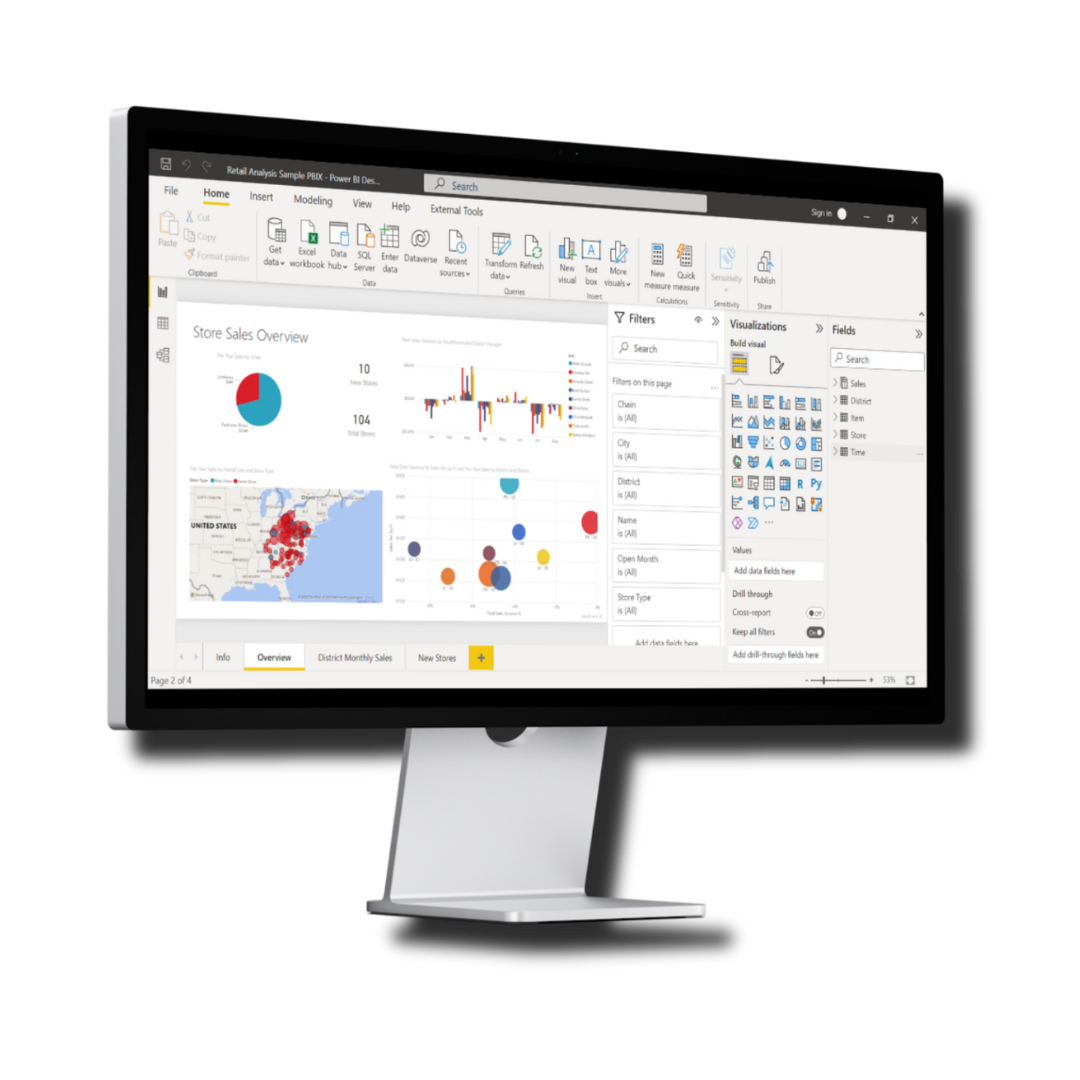
Dashboard analytics on Microsoft Power BI with bar charts and pie charts shown on a black monitor, supporting data aggregation and visualisation.

STRENGTHEN DATA INTO ACTIONABLE INSIGHTS

What is Microsoft Power BI?

Data from an organisation’s sources are analysed using Power BI.

Data sets can be combined, allowing cleaning up and turning the data into a data model, and producing charts or graphs to show the data visually.

  • Using charts and data visualisations to convey stories, investigating “what if” scenarios within the data, and producing reports that may address inquiries immediately and aid in forecasting are all ways to ensure that departments fulfil business metrics
  • Administrators or managers can also access executive dashboards to gain a deeper understanding of how departments operate

POWER BI FOR SMES IN THE UK

How Businesses Use Power BI

Power BI is used across industries to improve visibility and performance.

Financial Reporting and Analysis

Track revenue, cash flow, budgets, and forecasts in real time. Identify trends early and make data-led financial decisions.

Sales and Customer Insights

Monitor pipeline performance, conversion rates, customer behaviour, and sales forecasting from a single dashboard.

Operations and Supply Chain

Improve efficiency by tracking inventory, supply levels, logistics performance, and operational bottlenecks.

Executive Reporting

Give leadership teams a real-time overview of KPIs across departments, reducing reliance on static reports.

Dashboards in Microsoft Power BI show data visualisations with multicolored charts, executive metrics, and analytics panels across multiple screens.

VISUALISE DATA AND STRENGTHEN DECISION-MAKING

Microsoft Power BI Features

Microsoft Power BI offers a wide range of features, including intuitive data visualisation, interactive dashboards, and robust analytics tools, empowering users to turn raw data into actionable insights.

.

Power BI and Microsoft Ecosystem Integration

Power BI becomes significantly more powerful when integrated with:

  • Microsoft Dynamics 365
  • Microsoft Azure
  • Microsoft 365 (Excel, Teams, Outlook)
  • Power Platform (Power Apps, Power Automate)

This creates a fully connected digital ecosystem where data flows seamlessly between systems, removing silos and improving collaboration.

.

Benefits of Microsoft Power BI

Organisations using Power BI typically experience:

  • Improved operational efficiency
  • Reduced reporting and analysis time
  • Increased accuracy in forecasting
  • Better visibility across departments
  • Stronger data-driven decision making

According to Microsoft research, businesses using Power BI report significant gains in productivity and cost savings through automation and improved reporting efficiency.

.

Power BI for Business Growth

Power BI supports long-term business growth by:

  • Identifying new revenue opportunities
  • Highlighting inefficiencies in operations
  • Improving customer understanding
  • Supporting strategic planning with real-time data

It transforms reporting from a backward-looking process into a forward-looking business intelligence tool.

.

Why Choose Monpellier for Power BI?

At Monpellier, we help businesses design, implement, and optimise Microsoft Power BI solutions tailored to their needs.

We work closely with organisations to:

  • Build custom dashboards and reporting models
  • Integrate Power BI with existing systems
  • Improve data accuracy and governance
  • Train teams to use analytics effectively
  • Support ongoing optimisation and development

With decades of experience in Microsoft solutions, we ensure your Power BI setup delivers real business value from day one.

.

Related Microsoft Solutions

Explore how Power BI works alongside:

  • Microsoft Dynamics 365 Business Central
  • Microsoft Dynamics 365 Sales
  • Microsoft Power Apps
  • Microsoft Modern Workplace Solutions

Internal linking these pages helps build topical authority across your Microsoft ecosystem content cluster.

Any questions?
Check out the FAQs

Power BI is used to analyse data, create reports, and build dashboards that help businesses make informed decisions.


Power BI enhances Excel by allowing larger datasets, real-time dashboards, automation, and better visualisation capabilities.


No, Power BI is designed for both technical and non-technical users, with drag-and-drop reporting tools.


Yes, Power BI integrates directly with systems like Microsoft Dynamics 365, Salesforce, and many others.


Yes, Power BI is primarily cloud-based but also offers desktop and on-premise options.

REINVENT REPORT BUILDING WITH COPILOT IN POWER BI

Power BI Overview

Ready to Transform Your Data into Insights?

Have a Power BI project in mind? Speak to our team to discover how we can help you unlock the full value of your business data.

Email

info@monpellier.co.uk

Phone

0191 500 8150

Our Locations

Evolve Business Centre, Rainton Bridge Business Park, Cygnet Way, Houghton le Spring, Sunderland, DH4 5QY